This section describes how to configure monitoring in SuperCHANNEL. You can use monitoring to check the progress SuperCHANNEL has made converting your source data into the target sxv4 format.
Activating monitoring will slow down the conversion, particularly if the monitor is set to refresh at very small intervals.
What Metrics can be Monitored?
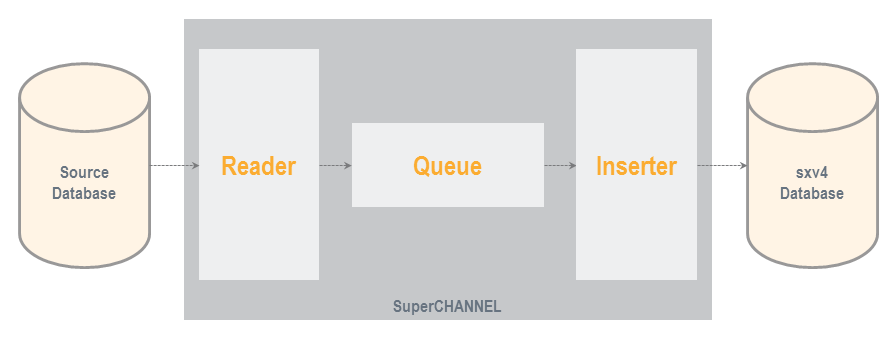
The following diagram shows a simplified overview of the components that SuperCHANNEL uses to convert from your source database to the target sxv4 format:
-
The Reader component reads from the source database.
-
The Inserter component writes records to the target database.
-
The Queue acts as a buffer to accommodate speed differences between the reader and inserter processes.
You can measure the following metrics:
|
Field |
Definition |
|---|---|
|
Reader Efficiency |
A measure of the activity of the reader, as a percentage. When it is 100%, the Reader thread is 100% busy. |
|
Queue Size |
The number of rows currently waiting in the queue between the Reader and the Inserter. |
|
Inserter Efficiency |
A measure of the activity of the Inserter, as a percentage. When it is at 100%, the Inserter thread is 100% busy. |
|
Row Rate |
The number of table rows processed per second (i.e. the number of rows converted from the source database to the target database per second). |
What Types of Monitoring are Available?
There are two monitoring options available:
-
File monitoring produces a text file activity log for the run.
-
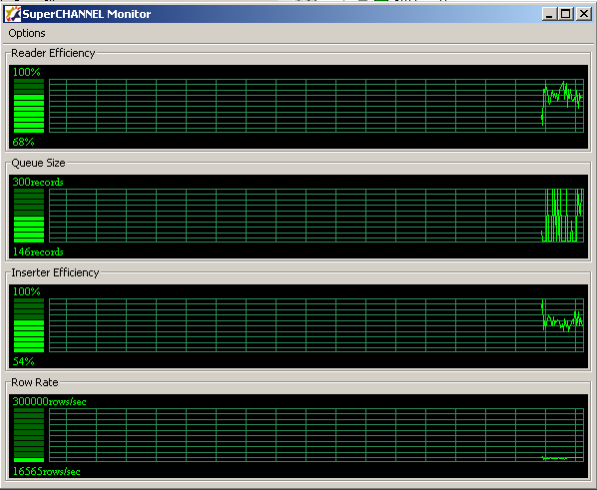
Graphical monitoring displays a dynamic graph of SuperCHANNEL activity.
File Monitoring: Sample Output
The table below shows a few rows from a monitor file, from the start of a run.
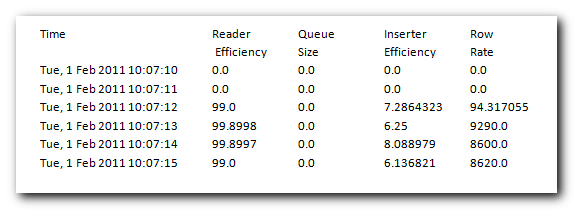
The monitor file will be written to C:\ProgramData\STR\SuperCHANNEL\scripts
The file name is in the form sc_monitor_YYYYMMDDHHMM.log (for example: sc_monitor_201112100638.log).
Graphical Monitoring: Sample Display
Configuring Monitoring
To configure monitoring you need to change the settings in the SuperCHANNEL config.txt file. If you selected the standard installation location, this file will be located in C:\ProgramData\STR\SuperCHANNEL\bin
To enable and configure monitoring, you can configure the following parameters. By default the parameters are commented out. Remove the # character at the start of the line to activate the parameter.
|
Parameter |
Description |
Examples |
|---|---|---|
|
|
The type of monitoring (graphical or file) to use.
|
|
|
|
The refresh rate in milliseconds (i.e. how often the monitor should write out results).
|
|
|
|
The maximum setting for the graphical display y-axis of the Row Rate chart. The monitor does not automatically adjust the y-axis to an appropriate scale if the data is too high or too low; this setting can be used to change scale to make the graph more readable. The default is 200000. |
|
Graphical Monitoring
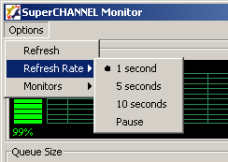
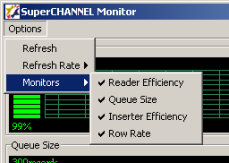
Once the graphical monitor is running, you can change some of its settings through the Options menu:
-
You can change the refresh rate:
-
You can select which metrics to display:
You can close the graphical display at any time during the run, although note that:
-
If you close the display you cannot open it again during the same run.
-
The overhead of gathering monitoring data will continue for the rest of the run regardless of whether the window is open.
