Summation Options
In order to create a meaningful table, you need to measure something. For example, using the sample Retail Banking dataset, you can choose to measure a simple count of customers, or you can generate a table that calculates something more complex, such as the mean customer profit or the median account balance.
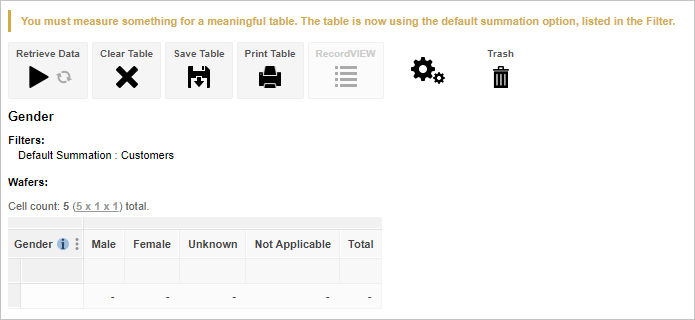
The Summation Options control what is being measured in the table. If you do not specifically add a summation option to your table, then SuperWEB2 will automatically add the default option set for that dataset. In the case of Retail Banking, the default summation option is a count of the number of customers. When you start creating a table from this dataset, SuperWEB2 automatically adds the default summation:
Understanding What is Being Counted
In many cases, the underlying data you will be working with in SuperWEB2 comes from multiple tables connected by relationships. For example, the sample Retail Banking dataset contains two connected tables: customer records and account records.
It is therefore important to understand what is being counted in your table. For example, with Retail Banking you might choose to count the number of customers or count the number of accounts. These will give different results (because customers can have more than one account):
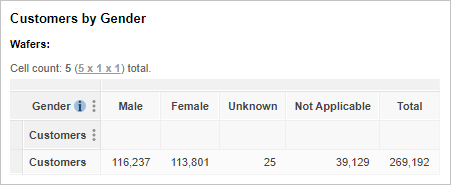
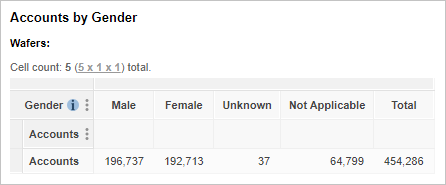
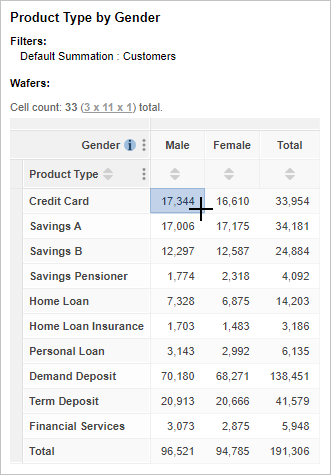
The following example table shows the Product Type field (from the Accounts table) against the Gender field (from the Customers table). The default summation (a count of the number of customers) has been applied; you can see this by checking the details in the Filters.
Because this table is counting customers, this means that (for example) the table shows that 17,344 males have at least one Credit Card product (it does not show the number of Credit Card products held by males):
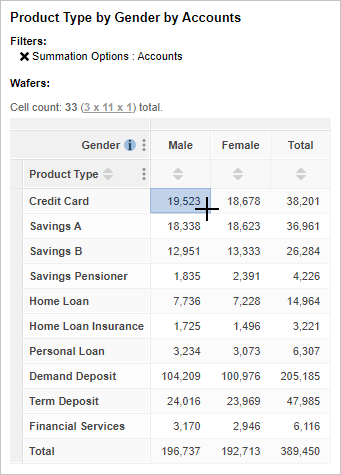
To see how many credit card accounts are held, we need to add the count of accounts to the table instead. The following example shows that there are 19,523 credit card accounts held by the 17,344 individual males who have accounts:
Available Summation Options
The available summation options are shown at the top of the tree in the customise table panel. Select an option and then click Add to Row, Column, Filter or Wafer to add it to the table.
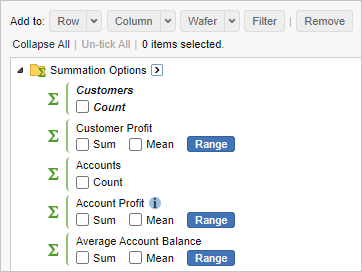
The available options will depend on the dataset and how it has been configured, but they may include:
- Count - a count of the number of records.
- Mathematical operations, such as sum, median and mean.
- Range - this option allows you to add quantiles or create custom ranges.
Mean and median are only available if your system has been configured to enable these statistical functions.
Quickly Select Summation Options
You can use the select arrow and drop-down list to quickly select all summation options, or to quickly select all summation options of a particular type (for example, all the counts, or all means).
For example, to select all means for all summation options:
- Click the arrow next to Summation Options.
Click Means:
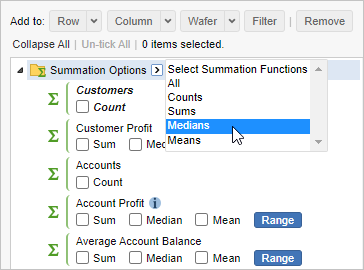
SuperWEB2 selects all means:
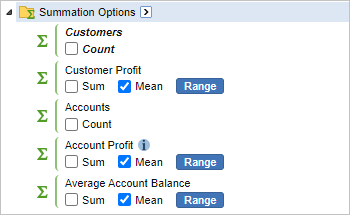
Click either Row, Column or Wafer to add the selections to the table:
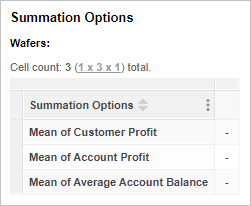
Quickly Select Summation Options in Folders
When your summation options are organised into folders, there will be a select arrow next to each level of the hierarchy. Using the option at a particular level will select all the matching summation options from that level and any others below it in the hierarchy.
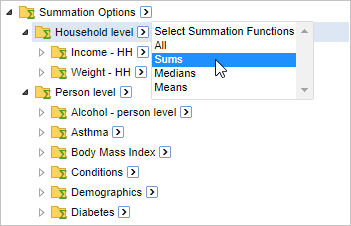
For example, the following dataset has summation options for Household level and Person level measures. If you choose Select Sums at the top level, this will select every available Sum measure. However, if you choose Select Sums from the Household level or Person level it will only select the measures at that level and below within the respective branch of the hierarchy.
