
Annotations
You can add annotations to charts to highlight something or describe or draw attention to something on the chart:
To add an annotation, select one of the options on the Annotations menu or the toolbar:
Option | Icon | Select To... | How to Add the Annotation |
|---|---|---|---|
Annotations > Text |  | Create a textual annotation. |
|
Annotations > Rectangle |  | Draw a rectangle. |
|
Annotations > Ellipse |  | Draw an ellipse. |
|
Annotations > Line |  | Draw a line. |
|
Annotations > Symbol |  | Draw a symbol. | Click and drag to draw an areas where you want to place the symbol on the chart. The symbol will initially be whatever symbol you used last, but once you have placed it on the image you can double-click to change the symbol (e.g. to a character from a font such as Wingdings) or replace it with a bitmap image. |
Annotations > Legend |  | Add a legend (key). |
|
Modify the Annotation
Double-click an annotation to open the Style Settings window, where you can modify the annotation settings.
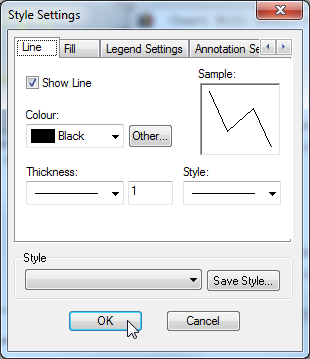
The following are some of the settings you can change (not all these settings are available for all annotations):
Tab | You Can... |
|---|---|
Line |
|
Fill |
|
Text |
|
Symbol |
|
Legend Settings |
|
Annotation Settings |
|
The Style Settings window also has a Save Style option, which you can use to save your settings as a preset for use with other annotations.
Arrange the Annotations
When you have added annotations to your chart you can arrange the order in which they appear by using the Annotations > Bring to Front or Annotations > Send to Back options. Select the annotation you want to move and then use the menu option to arrange your annotations.