Forecasting
SuperCROSS includes a forecasting feature, which allows you to predict future values based on past data. For example, you can use forecasting to answer the question: “what will next year’s sales be, based on sales for the last 10 years”?
Example: Forecast New Accounts using Retail Banking
The following is example of forecasting using the sample Retail Banking database.
The sample database contains details of the dates accounts were opened between 1944 and 2006. This example shows how to use that data to predict how many accounts will be opened in 2007, based on the data from previous 10 years (1997 - 2006).
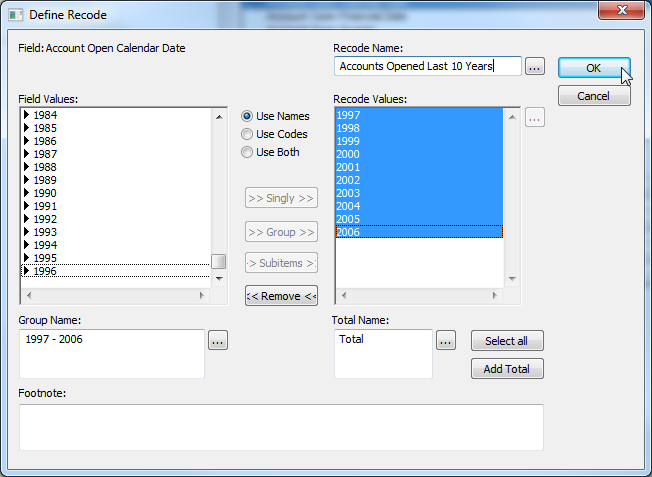
- The first step is to create a recode showing the number of accounts opened over the last ten years (the recode is not necessary for the forecast, but it makes it easier to view the data in a table).
- Add the recode to a table:
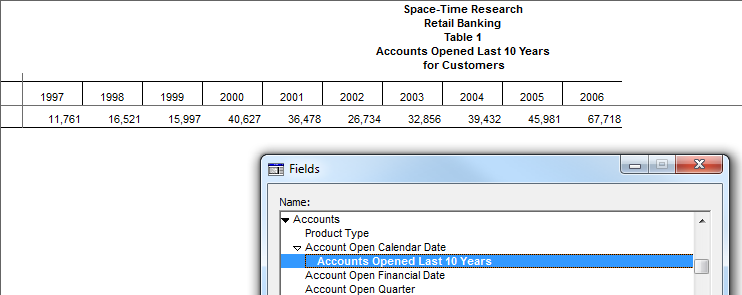
- To forecast the data for 2007, insert a field derivation by right-clicking on the column headings and selecting Derivations > Add Field Derivation.

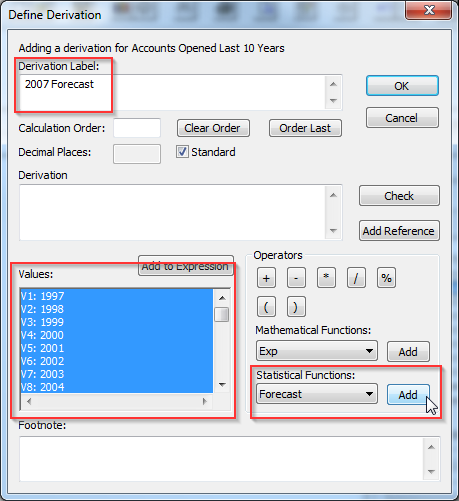
The Define Derivation window displays. - In Derivation Label, enter a suitable name for the derivation, such as 2007 Forecast (this will display in the column heading).
- In the Values section, ensure that the years you want to use for the forecast are selected (i.e. the last ten years).
- In the Statistical Functions section, select Forecast and click Add.
The Derivation section updates to show the formula for the forecast:
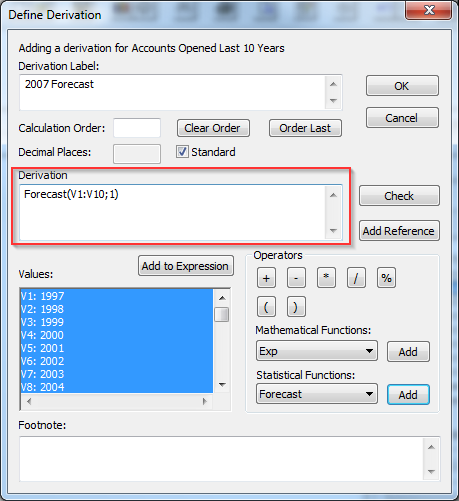
In this example the formula for the forecast is Forecast(V1:V10;1). The first argument to the Forecast function tells SuperCROSS which values to use for the calculation (in this case values V1 to V10). The second argument tells SuperCROSS which period to calculate (in this case it is 1, which indicates the first time period after the end of the periods used for the calculation). - Click OK. The forecast is added to the table.

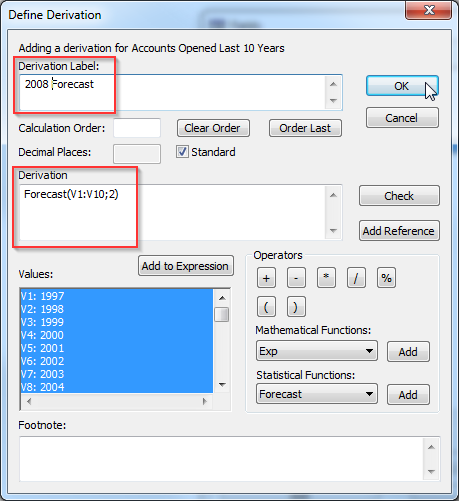
To add a forecast for the following year (2008), repeat the process but this time change the forecast formula to Forecast(V1:V10;2)

Forecasting Previous Periods
You can also use the forecasting formula to derive values for earlier periods. For example, if the figures available are for 1997 - 2006, you can impute a "forecast" for 1996 using the formula Forecast(V1:V10,-1)
Similarly, you can "forecast" for 1995 using the formula Forecast(V1:V10,-2)
Methodological Background: How are the Forecasts Calculated?
SuperCROSS forecasting is based on a “trendcast” algorithm that uses linear regression (the process of fitting a straight line to a dataset, under an assumption of best-fit). Given a dataset of x and y pairs, the algorithm first generates a new coordinate that is a linear mapping about the centroid of the x range. It then calculates the gradient and vertical offset of the best-fit line and projects the calculated line forward (or backward) to a new x co-ordinate.
The algorithm uses a well-established and published definition of “best fit” in the chi-squared description. This description is sensitive to outliers, which will spike or distort the fitted line, consequently distorting the forecast trend continuation.
The algorithm assumes that the y series is defined against a regular binned ordinate (i.e. the observations are made at regular intervals). Any deviation from this will skew the forecast series.
