User Guide
SuperWEB2 is a browser based client for the SuperSTAR platform. This user guide explains everything you need to know to get the most out of the SuperWEB2 client.
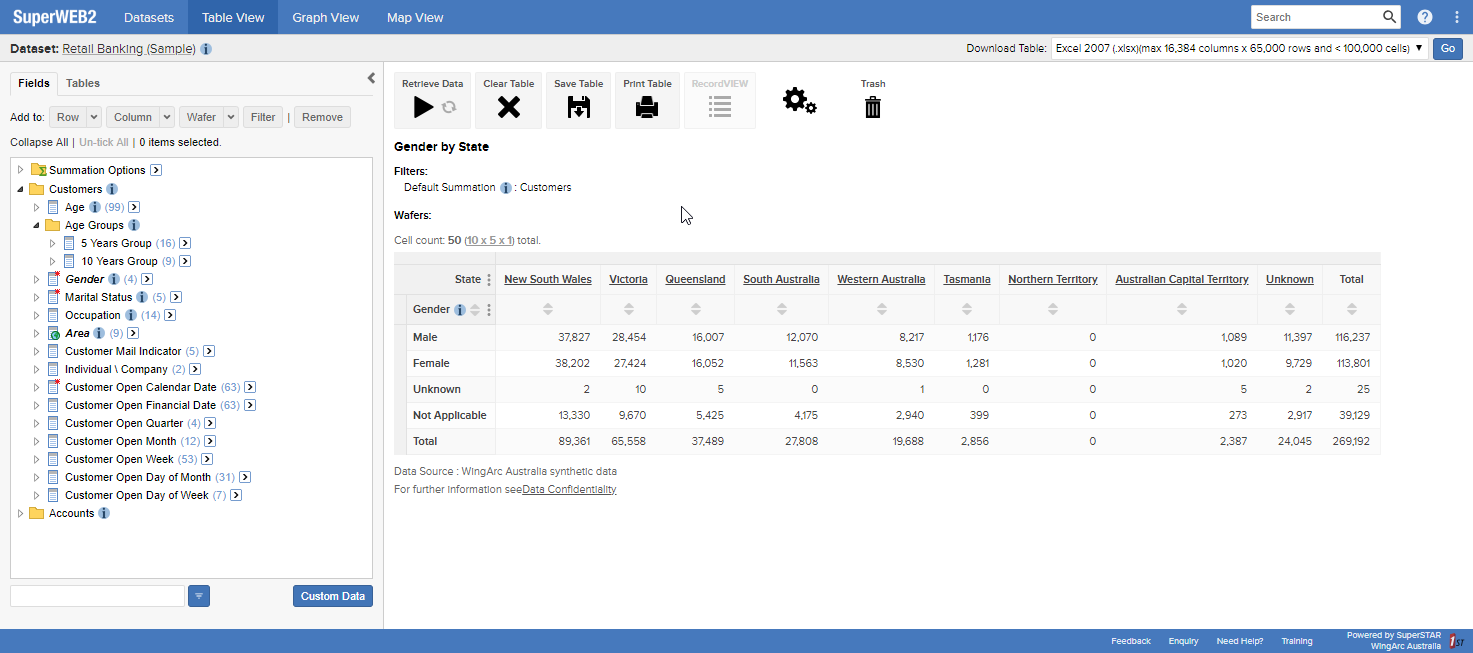
Once you have logged in, simply select the fields you are interested in and drag and drop to build your first table. Then you can run the query to get the data from the SuperSTAR database, and visualise the results using a graph or on a map. All you need to get started is your web browser.

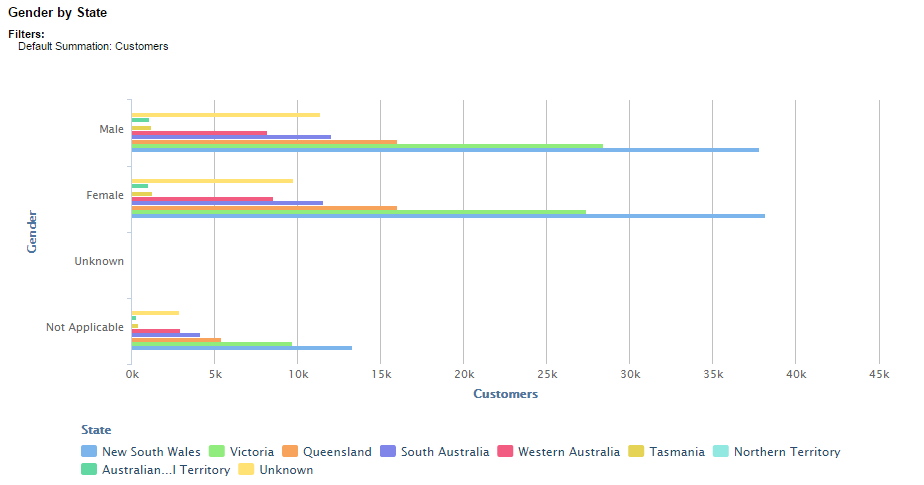
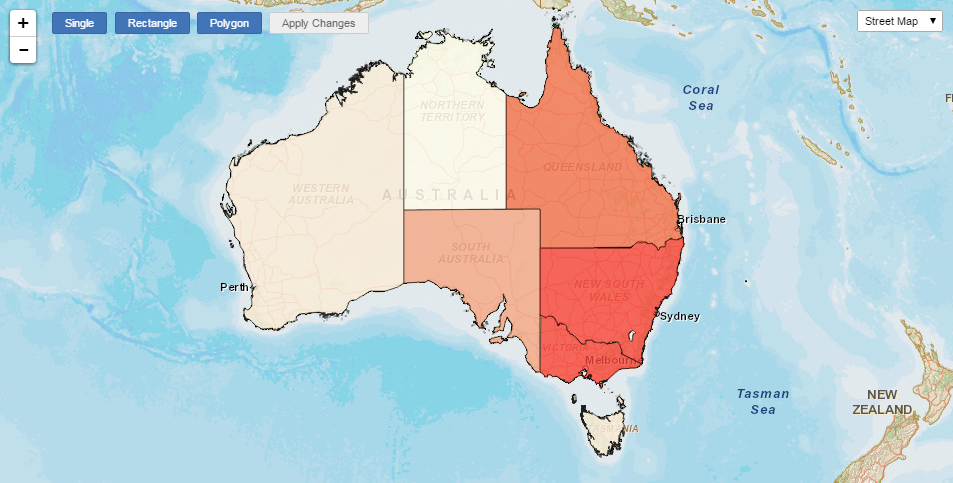
Once you have built a table, you can visualise the results using a chart or a map:
| Chart View | Map View |
|---|---|
|
|
Where Do I Start?
If you are new to SuperWEB2, then we recommend you step through the interactive tour that displays when you first log in, or follow the steps in the Getting Started section. This will give you everything you need to get started building tables.
Once you've learnt the basics, you can read more about features such as:
- Adding totals and viewing percentages.
- Creating custom groups of items (as known as recodes), which you can download and share with other users.
- Record View, which allows you to explore the underlying unit record data.
- Creating graphs or maps and downloading them in a variety of formats.
- Downloading tables to share with others, or saving them on the server for the next time you use SuperWEB2.


