
Trendlines
Trendlines allows simple linear and growth trend series to be created and displayed based on existing data. They are commonly used to study predictions (regression analysis) and can be used to indicate moving averages, where data fluctuations are smoothed to represent a pattern or trend.
A trendline can be added to a data series in a chart to indicate the trend, or direction of the data.
Only area, bar, column, line and XY (scatter) charts can create and display trendlines.
They are not available for 3D, pie, and radar charts.
To add a trendline:
- Select Chart > Trendlines.
The Trendlines window displays.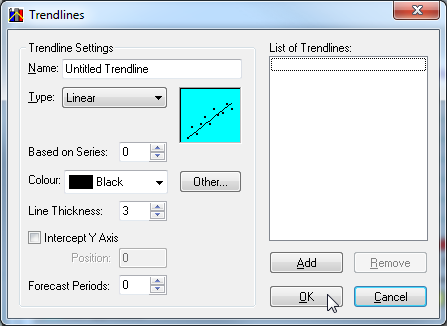
Define the trendline settings.
The following settings are available:
Setting Description Name The name of the trendline. This will be displayed in the List of Trendlines. Type The trendline type. The following options are available: - Linear - A calculation of the least squares fit.
- Logarithmic - A calculation of the logarithmic least squares fit through a series of data points.
- Polynomial - A calculation of the polynomial least squares fit through a series of data points.
- Power - A calculation of the least squares fit through a series of data points.
- Exponential - A calculation of the least squares fit through a series of data points.
- Moving Average - A sequence of averages derived from parts of a data series.
Order (Only applicable to Polynomial). The order of the polynomial. This can be any value between 2 and 10 inclusive. Period (Only applicable to Moving Average). The number of periods that the moving average trendline is based on. This can be any value between 2 and 10 inclusive. Based on Series The series that the trendline will be based on. The value depends on the number of series in the currently selected chart layer. Series are zero based, therefore, the first series is 0. Colour The colour of the trendline. Line Thickness The thickness of the trendline. This can be any value between 1 and 30. Intercept Y Axis Select this check box to allow the line to intercept with the y-axis. Not available for Logarithmic, Power and Moving Average trendlines. Position A point on the y-axis indicating the exact position where the trendline must intercept the y-axis. Forecast Periods The number of extra periods to forecast in the trendline. This can be any value between 1 and 30. - When you have finished configuring the settings, click Add to add the trendline to the list.
- Click OK to close the Trendlines window and view the updated chart.
You can reopen the Trendlines window and add additional lines. To remove a line, select it in the list and click Remove.