Open Data API: Power BI Tutorial
This tutorial provides basic steps for connecting the Open Data API to Microsoft Power BI. The examples use the WingArc Australia demo site, but you can easily adapt the steps to work with any instance of the Open Data API, as all versions of the API use the same basic data structure for the request and response.
Prerequisites
To follow this tutorial, you will need:
The URL of the
/tableendpoint for the API instance you want to query. The example here uses the WingArc demo site, located athttps://sw2.wingarc.com.au/webapi/rest/v1/tableAn API key that is valid for the instance you want to query. If you are using the demo site, then you can obtain a key as follows:
Register for an account at https://sw2.wingarc.com.au/
Log in to your account and click the menu in the top-right corner, then select Account.
Copy the key that is displayed under Open Data API Access.
A table query. The easiest way to create a query is to build a table in SuperWEB2 and then use the option to download the query in Open Data API format. Alternatively you can follow the documentation to create your query in a text editor.
Regardless of how you create the query, you will need to modify it for use with Power BI by escaping the double quotes. See the steps below under Prepare the Query Body for more details.
Step 1 - Prepare the Query Body
Before you can use your API query in Power BI, you need to escape all the double quotes by replacing them with two sets of double quotes. This is required because the query needs to be included within double quotes when passing it into Power BI.
For example, change the following query:
{
    "database": "str:database:bank",
    "measures": ["str:count:bank:F_Customer"],
    "dimensions": [["str:field:bank:F_Customer:Gender"], ["str:field:bank:F_Customer:Marital_Status"]]
}
To:
{
    ""database"": ""str:database:bank"",
    ""measures"": [""str:count:bank:F_Customer""],
    ""dimensions"": [[""str:field:bank:F_Customer:Gender""], [""str:field:bank:F_Customer:Marital_Status""]]
}
If you have downloaded the query from SuperWEB2, you may also want to edit or remove the recodes section if you want to have a query that will always update even if new field items are added (for example if new time periods are added to a date field). See Use SuperWEB2 to Build API Queries for more details.
Step 2 - Run the Query in Power BI
Open Power BI desktop and create a new Blank Query (Get Data > Blank Query).
Select View > Advanced Editor.
Delete the initial contents of the query and use the following query format instead, replacing the items in angle brackets with the relevant values for your system and query:
CODElet url = "<TABLE_ENDPOINT_URL>", body = "<API_QUERY>", header = [ APIKey = "<APIKEY>" ], response = Web.Contents(url,[Content=Text.ToBinary(body),Headers=header]), Source = Json.Document(response,1252) in SourceFor example:
CODElet url = "https://sw2.wingarc.com.au/webapi/rest/v1/table", body = "{ ""database"": ""str:database:bank"", ""measures"": [""str:count:bank:F_Customer""], ""dimensions"": [[""str:field:bank:F_Customer:Gender""], [""str:field:bank:F_Customer:Marital_Status""]] }", header = [ APIKey="65794a30255841694f694a4b..." ], response = Web.Contents(url,[Content=Text.ToBinary(body),Headers=header]), Source = Json.Document(response,1252) in SourceClick Done. If Power BI displays any errors then you will need to correct them before proceeding. If the query has run successfully, you should see a response similar to the following:

Step 3 - Transform the Data
The next step is to transform the data by mapping the labels and the data within the response. The data in the response is contained within the cubes section of the response, while the corresponding labels are returned in the fields section. The labels are not assigned to the values initially, but both the labels and the results are returned in the same order and the same hierarchy within their respective sections.
Therefore, by expanding both sections in the same way, you can create a flat table both the labels and their values. The basic process is as follows:
Transform the list of fields into a single row.
Get the labels by expanding each column in order from left to right.
Duplicate the query and use the same process to expand the values.
Add an index column to both the label and values queries and use this to join them together (this works because the order of the values and labels will be the same across the two queries).
Worked Example
The following is a worked example, using the query shown above (Gender by Marital Status for the sample bank dataset). You can easily adapt this example to any query you need to make.
Step 1 - Expand the Labels
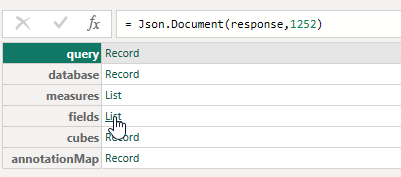
Starting with the result returned from the initial query, click List next to fields.
Select List Tools > Transform > To Table:

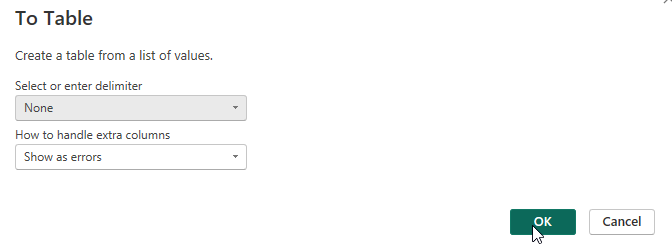
Leave the delimiter set to None and click OK:
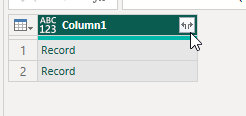
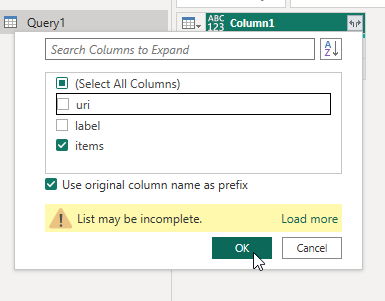
Click the icon in the top-right next to Column1 to expand the column, then select only items and click OK:
Click Transform > Transpose to switch the list from rows to columns:

Click the expand button in the top-right of the first column, and select Expand to New Rows:
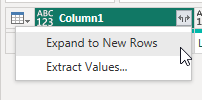
This creates a new row for each of the labels in this field:

Click the expand button again and select only the labels check box:
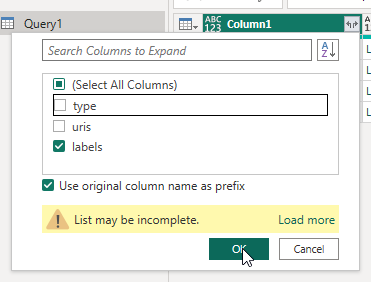
Click the expand button again and select Expand to New Rows:

This expands the labels for the first field:

Repeat the steps for all other columns, working from left to right:
Expand > Expand to New Rows.
Select labels only.
Expand > Expand to New Rows.
When you have expanded all columns you will see each combination of field items as a flat list (in order, matching the order of the values in the results cube).
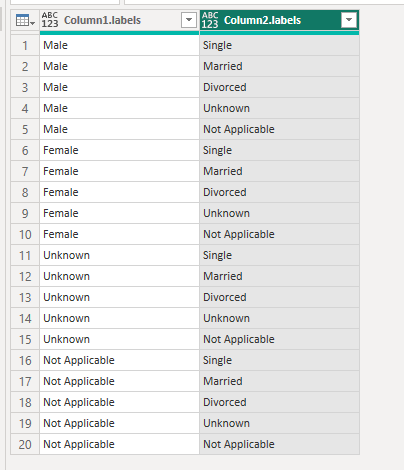
You can now double-click the column headings to rename the columns (and set the column type if necessary). For example:

Step 2 - Expand the Values
Right-click the previous query and select Duplicate. This creates a copy that we can use for expanding the values.
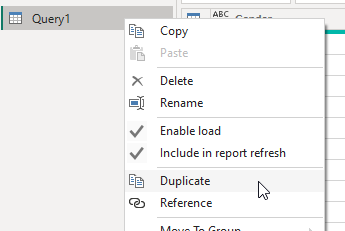
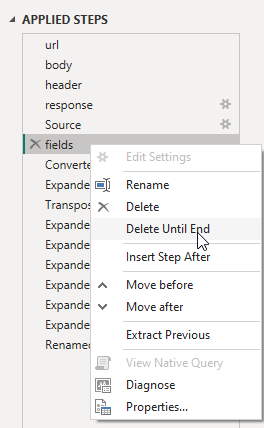
In the new query, go to the Applied Steps section, right-click the fields step, then select Delete Until End. This deletes all the subsequent steps from the duplicated query, leaving just the initial query result.
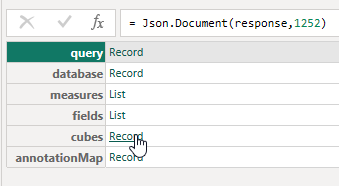
Click Record next to cubes:
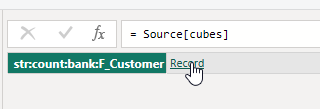
Click the next level Record:
Click the List:

Select List Tools > Transform > To Table:
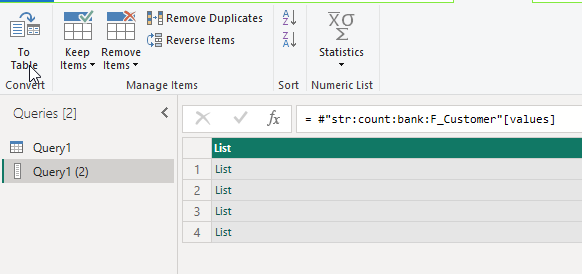
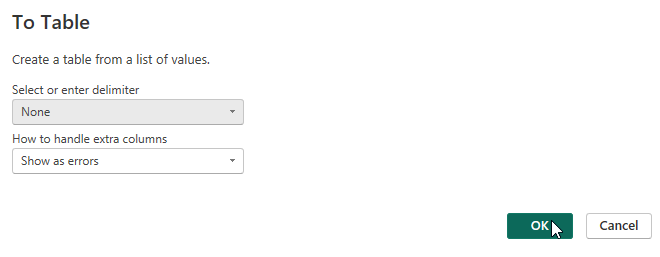
Leave the delimiter set to None and click OK to confirm:
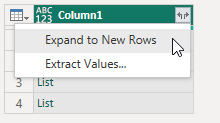
Click the expand button and select Expand to New Rows:
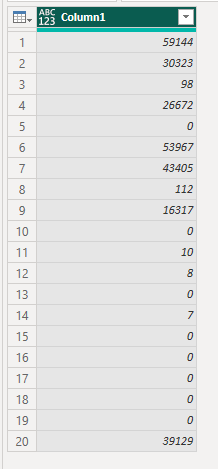
The values display (depending on the data structure of your specific query, you may need to continue expanding until you get to the values):
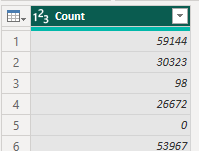
You can now double-click the column heading to rename the column accordingly, and change the data type to something appropriate depending on the result values. For example:
Step 3 - Create Index Columns
The next step is to create index columns on both queries and use these to join the results.
For each query, select Add Column > Index Column:
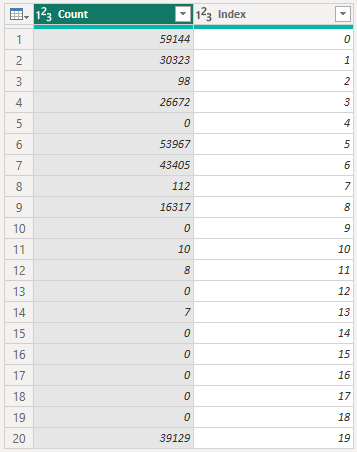
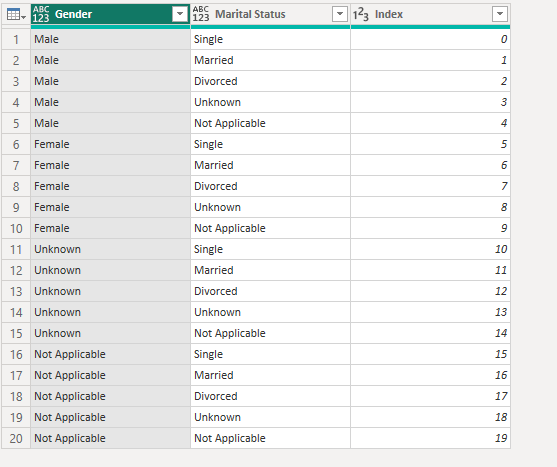
Step 4 - Merge Tables
The final step is to merge the tables from the two queries using the index column.
Go back to the first query with the labels.
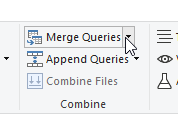
From the Home toolbar, select Merge Queries:
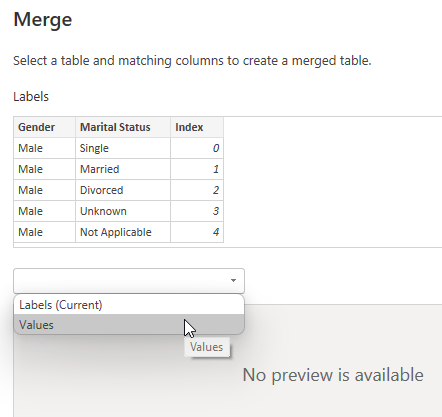
Select the query with the values from the drop-down box in the middle:
Select both index columns and a Left Outer join type, then click OK:
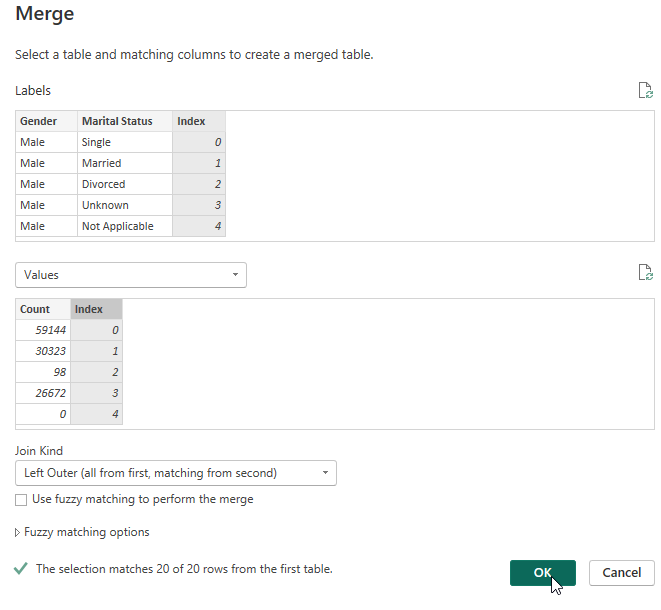
Power BI creates the combined query.
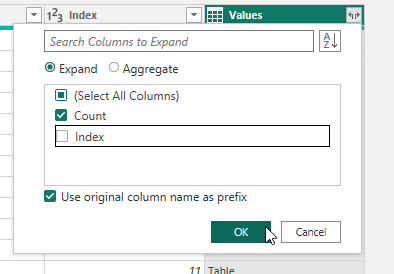
Click the expand button next to the added column and select only the column with the count / values in it, then click OK:
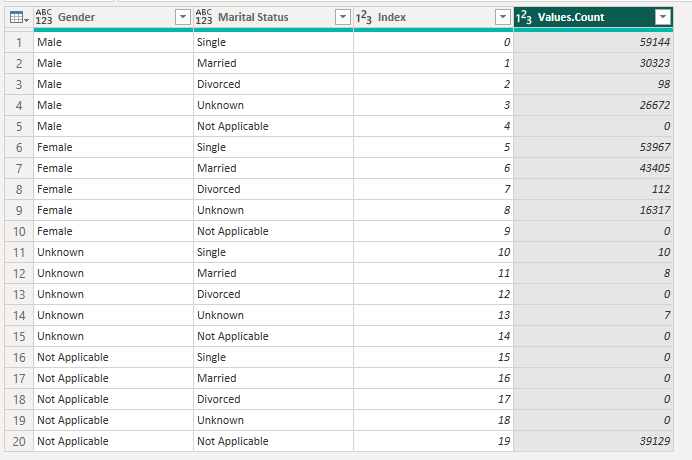
You should now see a single flat table with both labels and values:
Click Close & Apply to begin using your query in your Power BI project.
