Customise the Interactive Tour - SuperWEB2
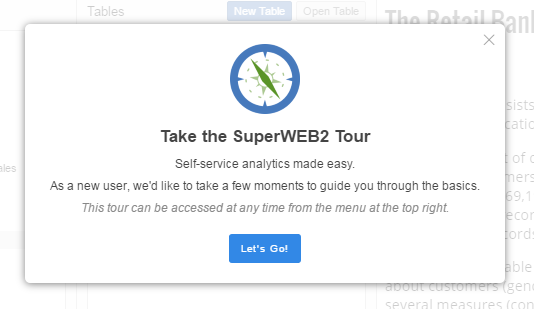
The interactive tour displays when users first log in to SuperWEB2. It is intended to give new users an overview of some of the key features of the product, and explain how to get started building tables:

The default content of the tour is generic information that shows how to use the sample Retail Banking dataset. You can customise the tour content so that it is tailored to your audience, for example by replacing references to the sample Retail Banking dataset with your own data.
While you can change the text and image content within each panel, it is not currently possible to add or remove panels from the tour, change the order in which they appear, or change their position on the screen.
To modify the tour content, you need to edit the file <tomcat_home>\webapps\webapi\WEB-INF\classes\common_labels.properties
There may be multiple copies of this file for different languages and locales, with names like common_labels_ar.properties and common_labels_de.properties. Each one contains the text used for different languages. Depending on which languages are in use on your deployment, you may need to make these changes in multiple versions of the file, and you may wish to translate the tour content into other languages that are in use on your deployment.
The properties file that is used will depend on the language settings in the end user's web browser, the set of supported locales defined in the faces-config.xml configuration file, and the language selected by the user from the drop-down list. See Multilingual and Localisation Support - SuperWEB2 for more information about localisation and how SuperWEB2 uses the properties files.
The text used in the tour is contained in the following properties:
guides.button.<key> | These properties define the text used in the buttons within the tour, such as the back and next buttons:
CODE
|
|---|---|
guides.tableView.<key> | These properties define the text used for all tour panels shown in Table View:
CODE
|
guides.datasets.<key> | These properties define the text used for all tour panels shown in the dataset catalogue screen:
CODE
|
Formatting Text
When providing content for the tour, you can use HTML tags and CSS styles to layout your content. For example, use heading tags to identify the title of each panel (the default text uses <h3> for all headings), and <p> tags for the body contents of each panel. If you wish to define additional CSS styles, you can do so by adding them to <tomcat_home>\webapps\webapi\tour\tour.css.
Providing your Own Screenshots
The screenshots that are included in the default tour content show the sample Retail Banking dataset. You will probably want to replace these with your own images showing one of your own datasets.
All the default image files are located in <tomcat_home>\webapps\webapi\images\guides.
If you are providing your own images you can either save them to this directory or to another location that is accessible to the web browser. Use <context-path> in your HTML <img> tags to reference the <tomcat_home>\webapps\webapi directory root. For example, the following tour content displays an image file located at <tomcat_home>\webapps\webapi\images\guides\Guides01.png:
guides.tableView.fieldList=<h3>Drag and Drop to Get Started</h3><p>These are all the fields available for analysis.</p><p>Click and drag items from the list to start building your table: </p><img src="<context-path>/images/guides/Guides01.png" draggable="false" width="331" height="145"/>width and height properties of the img tag to match the width and height of your images.
Escape the ' Character
If your text contains any instances of the single quote character, you must either replace this with the HTML entity code, ', or escape it using a backslash: \'. For example:
guides.datasets.welcome=<p class="centerImg"><img src="<context-path>/images/guides/Tour.png" class="welcomeIcon" width="70" height="70"/></p><h2>Take the SuperWEB2 Tour</h2><p>Self-service analytics made easy.</p><p>As a new user, we'd like to take a few moments to guide you through the basics.</p><p><i>This tour can be accessed at any time from the menu at the top right.</i></p>
guides.datasets.databases=<h3>Datasets</h3><p>These are all the datasets available to you. Select one to see more information.</p><p>Double-clicking will open a dataset but we\'ve got a few more things to show you first.</p>