
Charts
SuperCROSS has built in charting functionality that allows you to easily create charts of your data with just a few clicks of the mouse.
Charting functionality is subject to licensing. It may not be available in your deployment if your SuperCROSS licence does not include access to the chart functionality.
To create a chart:
Create a table.
Select the rows/columns you are interested in (or select all cells if you want to create a chart based on the entire table).
Select File > Create Chart, or click

SuperCROSS creates your chart.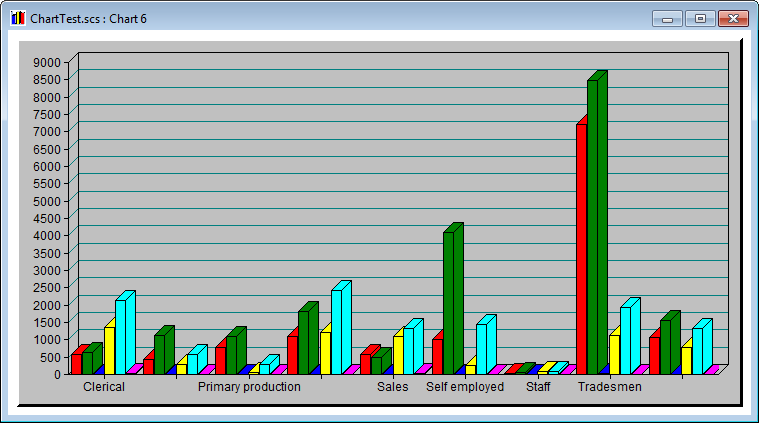
You can now customise the chart:
Change the chart to a different type of chart. Select Chart > Chart Type and choose one of the chart types from the menu.
Add annotations to highlight something or describe or draw attention to something on the chart.
Use the Layer Control window to show and hide the chart layers.
Use the Chart Explorer to modify the components displayed in the chart.
Add Trendlines.
See Settings to learn about other chart settings you can change.
For a full list of the options available in chart mode, see Menu Options 1.
Did You Know?
By default, the chart will automatically update if you change the selected cells in the table. You can configure this behaviour in the Layer Control window.