
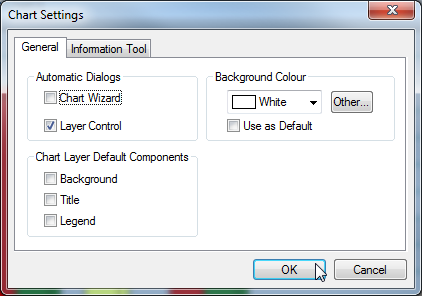
Select View > Chart Settings to edit chart settings. The Chart Settings window displays.
The following settings are available:
General Tab
|
Setting |
Description |
|---|---|
|
Automatic Dialogs |
Select these options to automatically open the Chart Wizard and/or Layer Control window every time you create a new chart. |
|
Chart Layer Default Components |
Select these options to automatically create charts with a Background, Title and/or Legend. |
|
Background Colour |
Set the chart background colour. Select the check box to make this the default setting for future charts. |
Information Tool Tab
|
Setting |
Description |
|---|---|
|
Information Window Delay |
Set the delay before the ToolTip appears when using the Info tool (Tools > Info). Acceptable values are between 0.01 and 10 seconds. |
|
Text Colour |
Set the text colour to use for the information ToolTip. Select Use Windows Default to use the default system setting. |
|
Background Colour |
Set the background colour to use for the information ToolTip. Select Use Windows Default to use the default system setting. |
|
Annotations |
Configure what is displayed in the ToolTip annotations. |
|
Values |
Configure whether data values display in the ToolTip and the number of decimal places. |