Configure Graph View
There are a number of settings you can configure for Graph View:
Colours
Default Colours
To change the default colours, edit the hexadecimal colour codes in the sw2-chart-config-options.js configuration file.
Set Colours for Specific Field Items
In addition to configuring the default colours, you can configure specific colours for specific field items. For example:
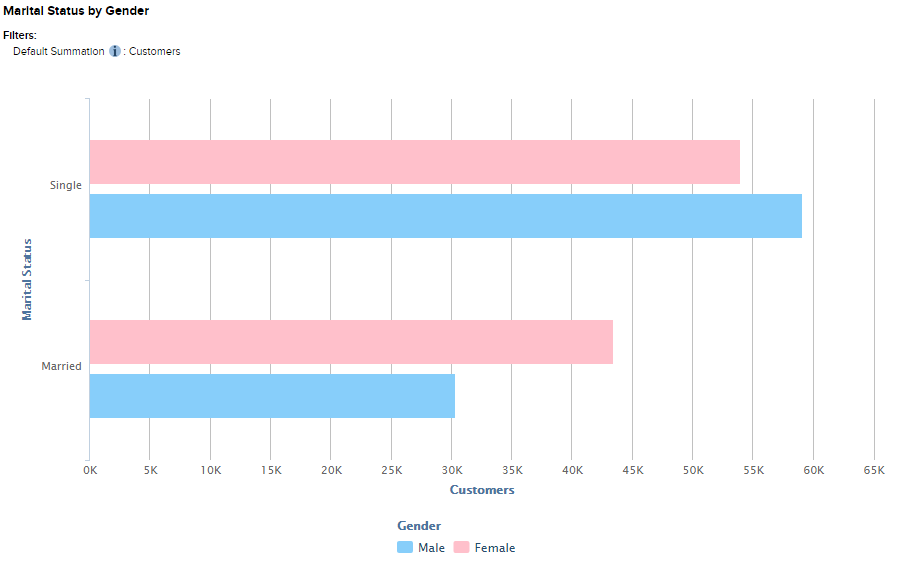
You can set a colour value for a particular field item by changing settings in SuperADMIN. Use a command similar to the following:
cfg db <dataset_id> superweb2.fieldValueColors.<field>.values.<value> set <color>Where:
<dataset_id> | The ID of the dataset this setting applies to. |
|---|---|
<field> | The ID of the field. You can obtain this from SuperADMIN. Use the command
CODE
In this example, the ID you need is |
<value> | The code of the field value to apply the colour setting to. You can obtain these from SuperADMIN. Use the command
CODE
In this example, the ID for Victoria is |
<color> | The colour value to use, enclosed in double quotes. You can either use HEX codes, such as "#FF000" or one of the browser-supported colour names, such as "Red" or "Blue". |
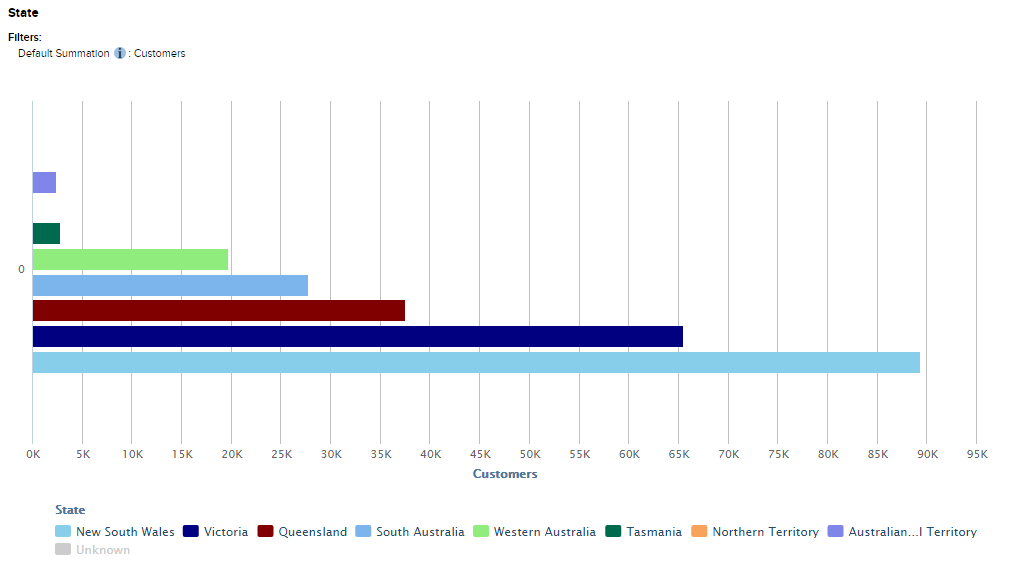
For example, the following commands set specific colours for New South Wales, Queensland, Victoria and Tasmania:
cfg db bank superweb2.fieldValueColors.SXV4__Retail_Banking__F_Customer__Area_FLD.values.1 set "SkyBlue"
cfg db bank superweb2.fieldValueColors.SXV4__Retail_Banking__F_Customer__Area_FLD.values.3 set "Maroon"
cfg db bank superweb2.fieldValueColors.SXV4__Retail_Banking__F_Customer__Area_FLD.values.2 set "#000080"
cfg db bank superweb2.fieldValueColors.SXV4__Retail_Banking__F_Customer__Area_FLD.values.6 set "#006A4E"
As shown by this example, any values without specific colour settings will use the default graph view colours:
Notes about Colour Settings
Only one field at a time can have its colours applied per graph.
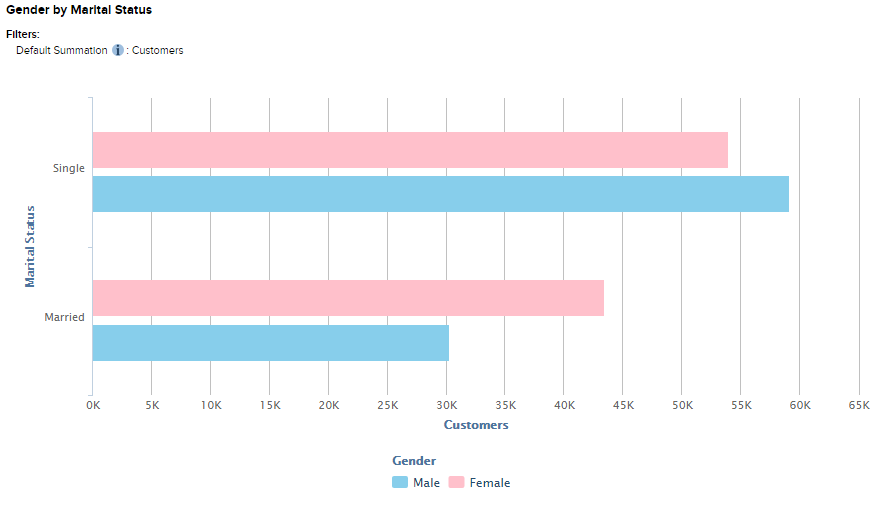
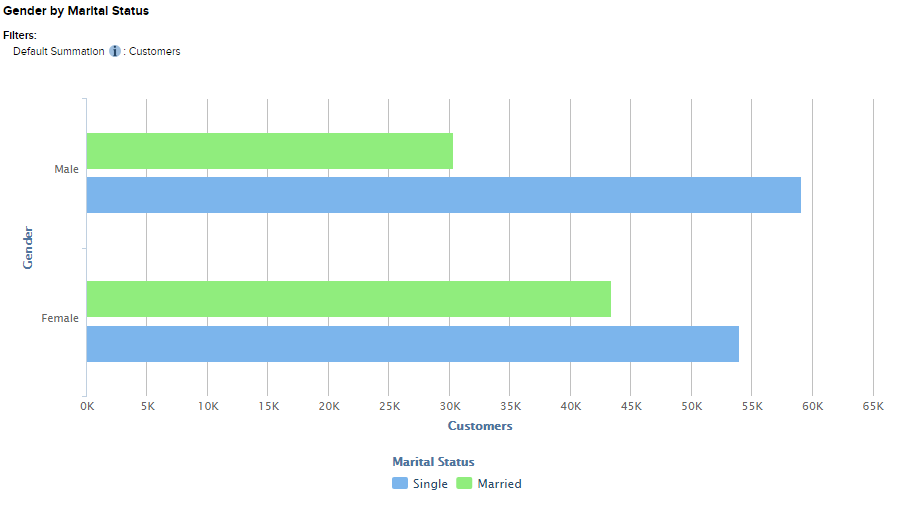
For example, suppose we have configured specific colours for both Marital Status and Gender and we create a graph containing both fields. Should SuperWEB2 use the Marital Status colours of the Gender colours?
The answer will depend on which field is in the series (the list of values in the legend at the bottom of the table) and which field is in the categories (the values listed in one of the axes of the graph itself):
 |  |
SuperWEB2 uses the following rules to choose which set of colours to apply:
- If there are items in the series, the colours will come from this field (as shown in the above examples).
- The colours for the field in the categories will only be used if there is no field in the series at all, and only for bar, column and pie charts. Line charts will not apply field colours if there are no items in the series.
- If there are nested fields in the dimension providing the colours (i.e., series or category), then the colours will be taken from the first item in the hierarchy that has custom colours set.
- If the dimension providing the colours has no fields with custom colours then the default colours will be used.
Colour Gradations
Colour gradations will be used in certain situations where there are nested items and there would otherwise be no way to tell the difference between individual items in the graph. For example:
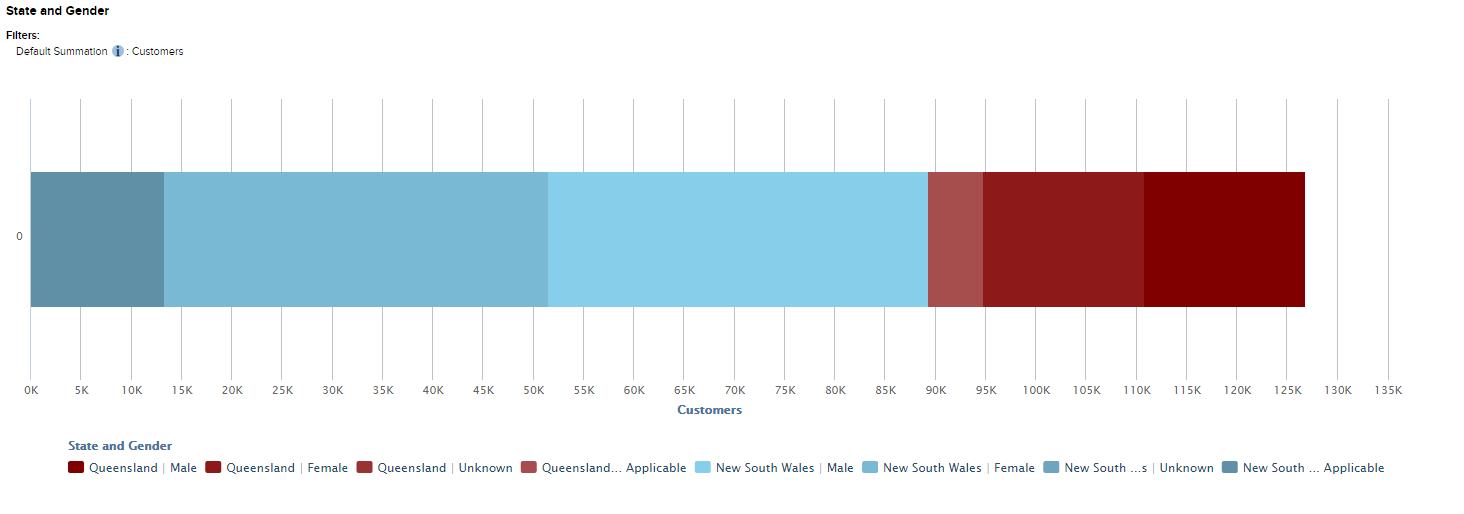
In this example, both Queensland and New South Wales have specific colours configured, but without the gradations, it would not be possible to tell the difference between different genders in each state.
Gradations are only used with nested items that are only identifiable via the legend (i.e., they are not directly labelled in the graph), and only when items within a colour set are repeated without another item in between.
You can configure the number of gradations to use for a given field with the following command:
cfg db <dataset_id> superweb2.fieldValueColors.<field>.nestedGradations set <value>If more than the specified number of gradations are required, SuperWEB2 will cycle through the specified number of gradations. For example:
cfg db bank superweb2.fieldValueColors.SXV4__Retail_Banking__F_Customer__Area_FLD.nestedGradations set 5Cell Limit
By default, users will not be able to access Graph View if the number of visible cells in their table exceeds 1,000.
You can change the cell limit by editing the value of the graphView.maxCells property set in the configuration.properties file. You will need to restart the SuperWEB2 service to apply this change.
Download Settings
You can change various settings for PDF and PNG downloads by editing the sw2-charts\sw2-chart-export-options.js configuration file.
Other Settings
You can change a number of other settings by editing the sw2-chart-config-options.js configuration file:
- You can change the type of graph that is initially displayed when a user opens Graph View.
- You can disable some of the toggle options.
- You can change how very large numbers are abbreviated.
